How Slow do you go ? - Auditing your page speed sitewide
SEO
Share
This will be part of a series of blog posts on page speed. I know the internet is full of them but this is a how to get started series which will hopefully introduce some quite awesome concepts. However, before we can tell you how to speed up, we need to have a rough idea of how slow you are now, and importantly where you are slow.
Google has an obsession with page speed - which is good because slow loading pages aren’t just frustrating, they often mean you can’t complete the task, frustrating for your customers and costing money for your business. Even if people do buy from you, next time they will probably visit a competitor. You won’t just lose a sale, you will lose all the sales from that customer. Page speed also impacts crawl rate - if your site is delivering content to Googlebot faster, it can and will consume more.
But how do you know if you have a problem? How do you benchmark yourself? How do you audit your website? The good news is there’s an array of tools that can be used and actually they all have their own uses, so where to start?
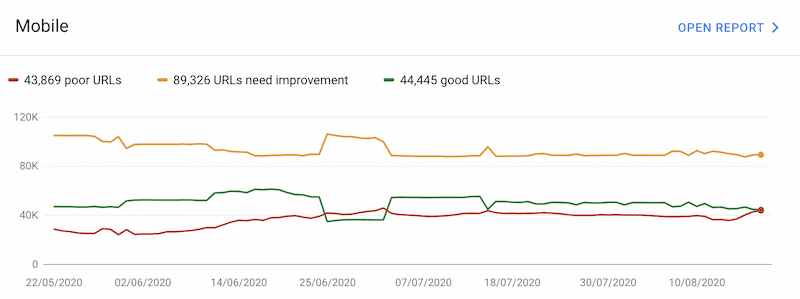
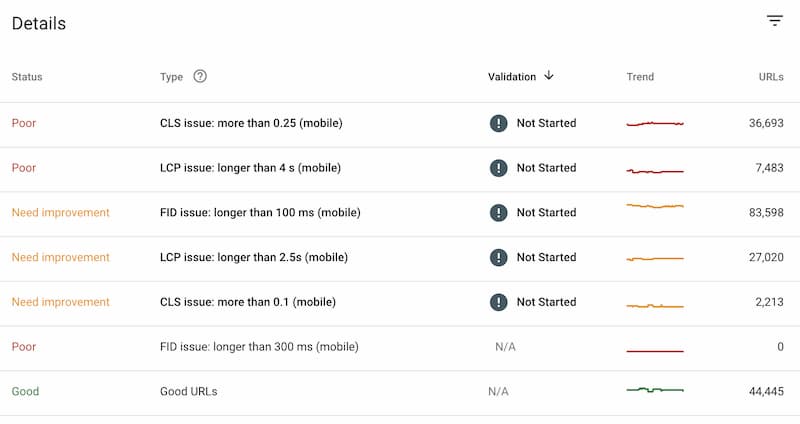
If it is your website then start in Google Search Console. Google gives you data about your own website readily available within a section called the Core Web Vitals. Not a huge amount of data here, just how many of your pages Google thinks are slow and how many it thinks are fast.
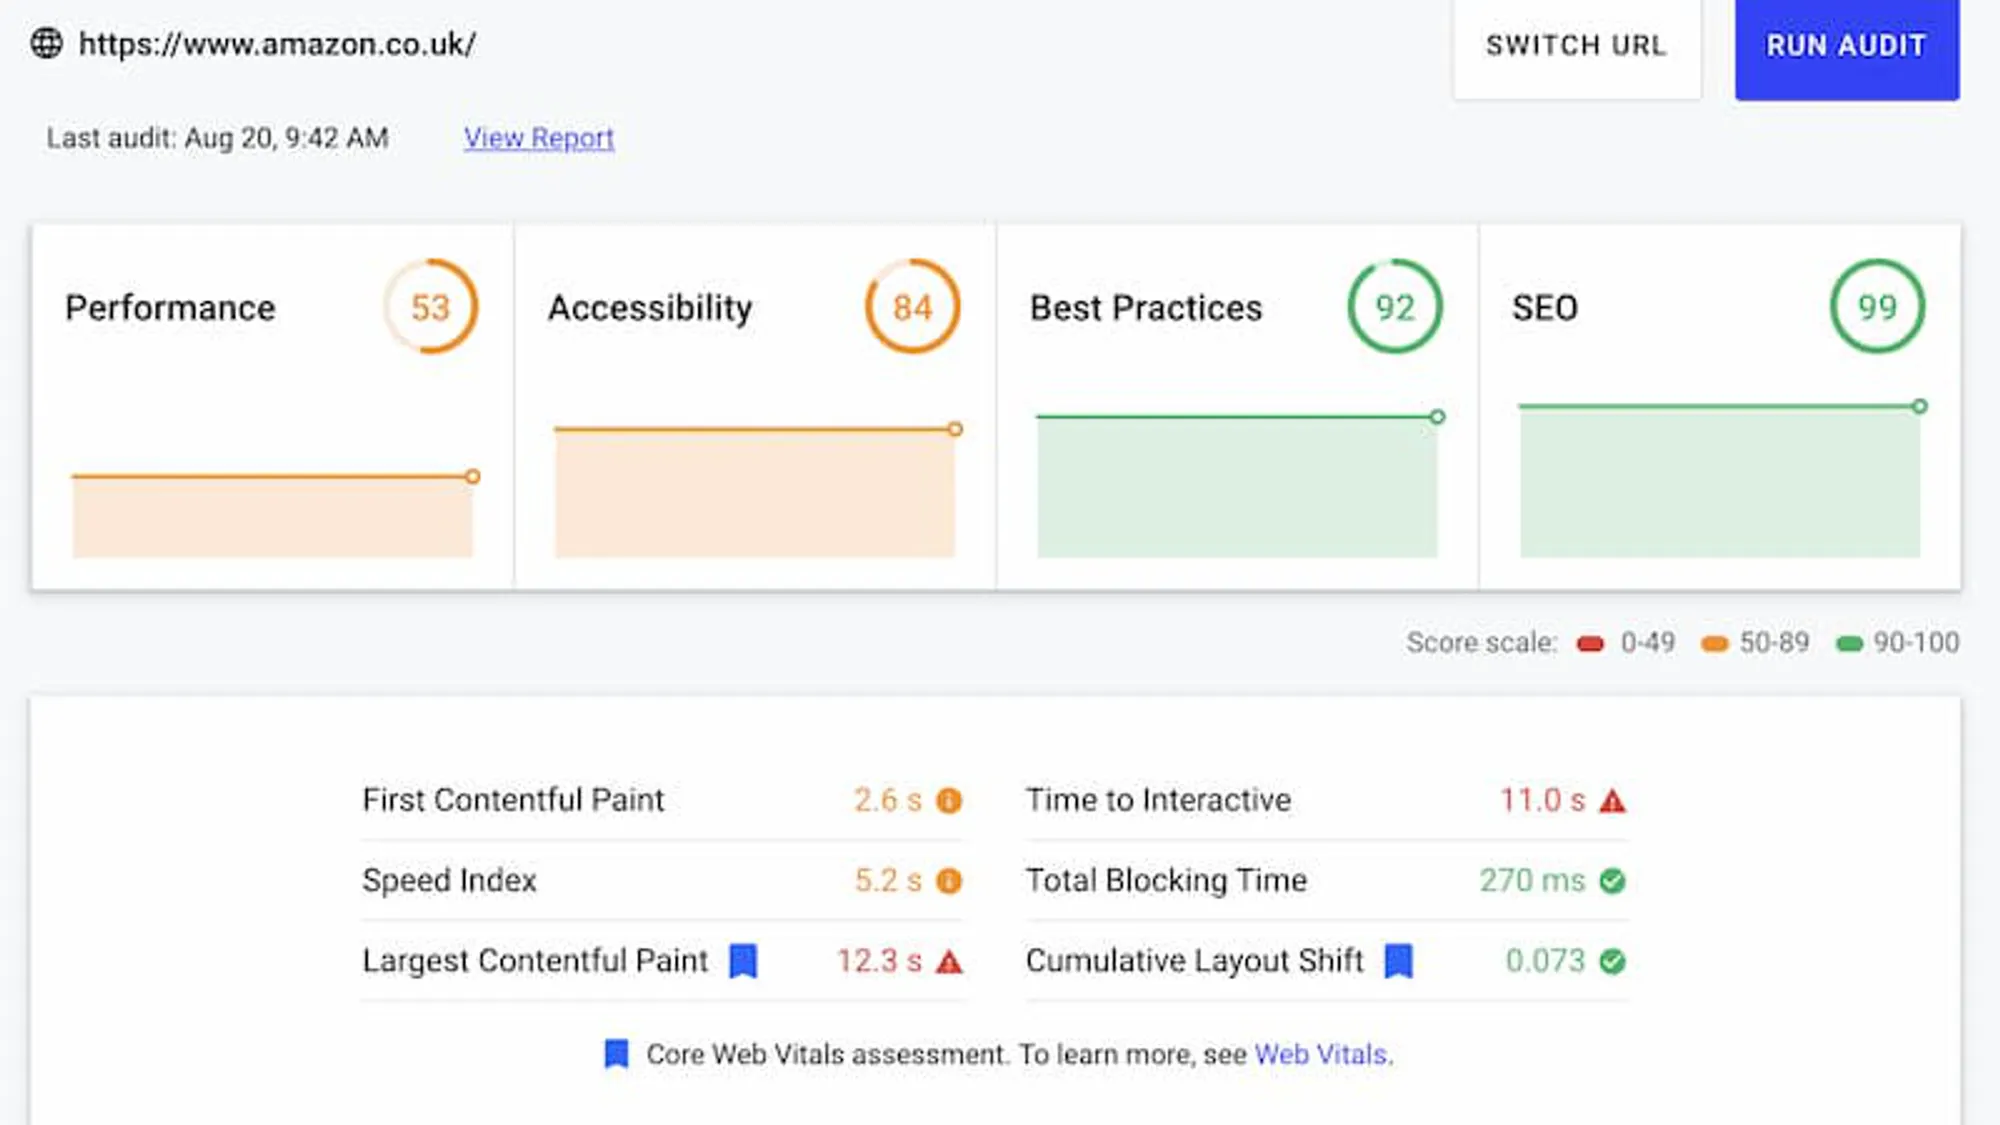
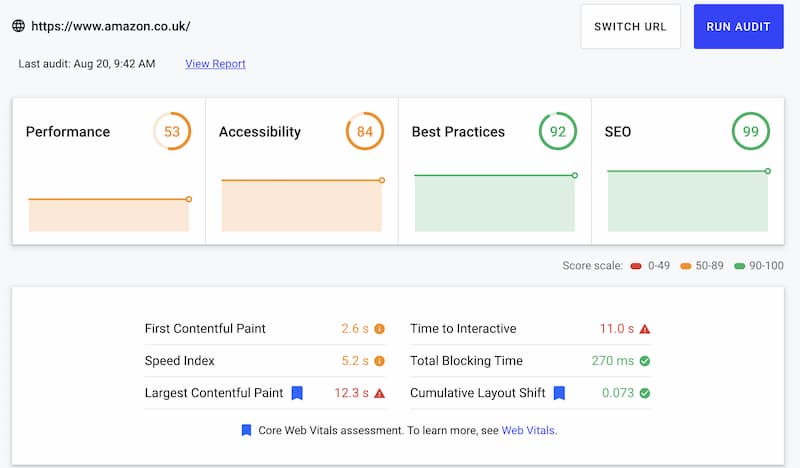
The data does list the metrics - LCP, FID, and CLS that Google has said will be ranking factors as they are a key part of the user experience.
LCP is the Largest Contentful Paint - “The amount of time to render the largest content element visible in the viewport,” FID is First Input delay, or how long before the webpage is interactive, and finally CLS is Content Layout Shift - this is a newer one, but has been a frustration of users for years, when buttons jump as the page finishes loading.
Even if Google says your website is fine, it is worth investigating this a little further. Even minor improvements on your website can deliver quite a significant impact.
Lighthouse is one of the first stops. It is a service to audit websites built right into Chrome and it will give you easy to use scores and easy to understand recommendations. Click the three dots to open the menu, more tools then developer tools, one of the tabs along the top will be Lighthouse. Select all your options and then click Generate Report. Actually before you do that open the page in ‘incognito mode’, this means that your chrome extensions won’t corrupt it. If you want to run it online and have shareable results in a URL then check out web.dev/measure/
If you are testing single pages, there are two other sites that are popular:WebPageTest.org is one of the oldest and still one of the most popular.GT Metrix is similar, and has been increasing in popularity. Plus with a free account you can benchmark and monitor over time.
I would of course recommend testing your money pages, which on an ecommerce website is your homepage, your product listing pages, your product page, then any key campaign pages such as your sale pages. If you are a brick and mortar company, also test your store location pages.
Chrome has a whole suite of performance tools built into it - allowing you to really get to grips with page speed issues on your site, but I will come onto those later in this series.
Audit all the pages
Of course the problem with taking a sniper approach - if you have a website of thousands of pages - is that it will take you time. There are two tools which we use to audit your website by crawling the site, SiteBulb and the ever faithful Screaming Frog. Screaming Frog can hook up to Google PageSpeed Insights API, and as you run a crawl over your site it will pull in scores for 75 metrics. You can export your data and sort it by performance score, highlighting the lowest scores so you know exactly where to start.
Screaming Frog will will also automatically pull in image sizes for all assets loaded (unless it is done by using JS or it is background image). These can be fetched if you are using the JS Rendered version. Doing this will significantly slow down
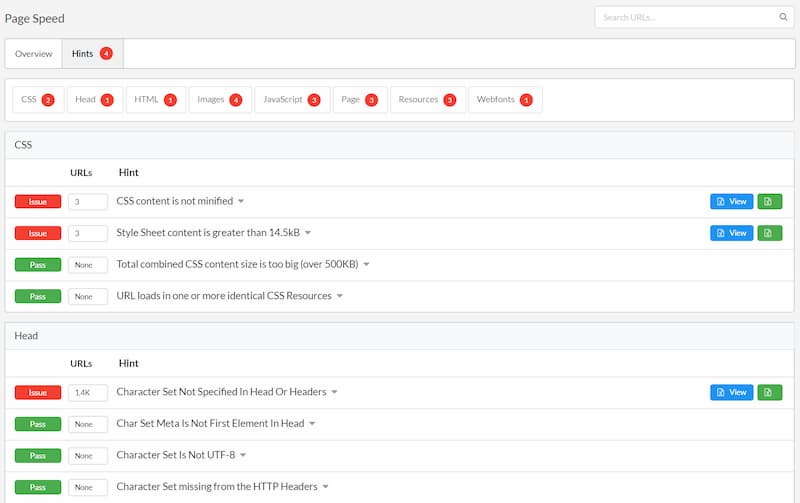
Sitebulb has even more features and rather than using the API and Google tool kit it fetches the information itself. It also includes a rather neat code coverage report and shows some detailed hints on where and how to improve.
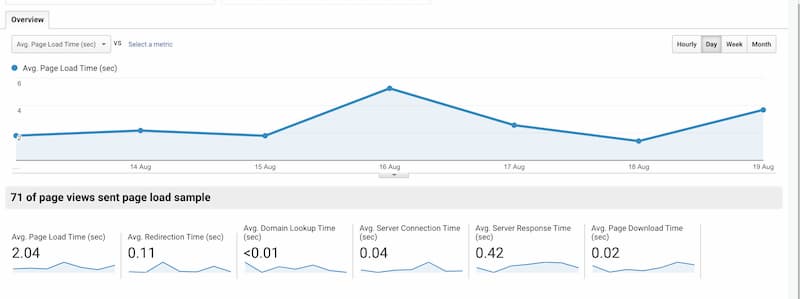
The final resource for finding the bottlenecks, the important but slow pages on your site, is within your Google Analytics. This isn’t the best place as the data can be a little less useful than other spots, but it is still a great place to find data on your users on your site. This data is available via an API so you can even create a dashboard in Google Data Studio (DataStudio Hacks).
For some reason in Google Analytics it is sampled at quite a low rate, but this can be fixed relatively easily to increase your sample size.
It is also important to monitor it over time. All of our clients are set up with a customised version of the CRUX dashboard which focuses on the ‘web vitals’ metrics within their dashboards, while we also monitor using GA. One solution you can use is ‘Lighthouse in the Clouds’ a project by Simo Ahava. It has a couple of issues in that the cloud based Chrome on Google Apps engine gives lower scores than if you run it locally, however to benchmark and monitor yourself against competitors it is a fantastic tool.
Our approach which we are working on is to pull Page Speed Insights using Google's API. This has data from CRUx and Lighthouse that it pulls into a Big Query dataset - this then gets pulled through into our own monitoring tool built in DataStudio.
So what next? Well the best thing would be to follow Gerry and Rise at Seven on Twitter so you can see when we write the next blog post on page speed optimisation!