Clearer information in Google Search Console - The new Crawl stats Report
SEO
Share
Google Search Console is often the first port of call when assessing a site for problems, and being able to interpret the information and spot any potential issues can be hard with the masses of data it presents - especially when you're dealing with large sites.
The coverage report is one of the more useful sections when investigating issues, however even to the trained eye, these reports can be confusing and give you more questions than answers.
Google have released an updated version which now has new and improved Crawl Stat reports, which contains some very useful information and is a massive step in the right direction. Crawl stats were in the old report, but not in the new one, and a few of us believed it wouldn’t make the transition.Whilst this isn't something we want our clients to be obsessed over, to a technical SEO this information can be a goldmine. It’s a little bit of useful information that tells us the missing piece of the puzzle as to why a page is missing, or a particular page hasn't been crawled in months.
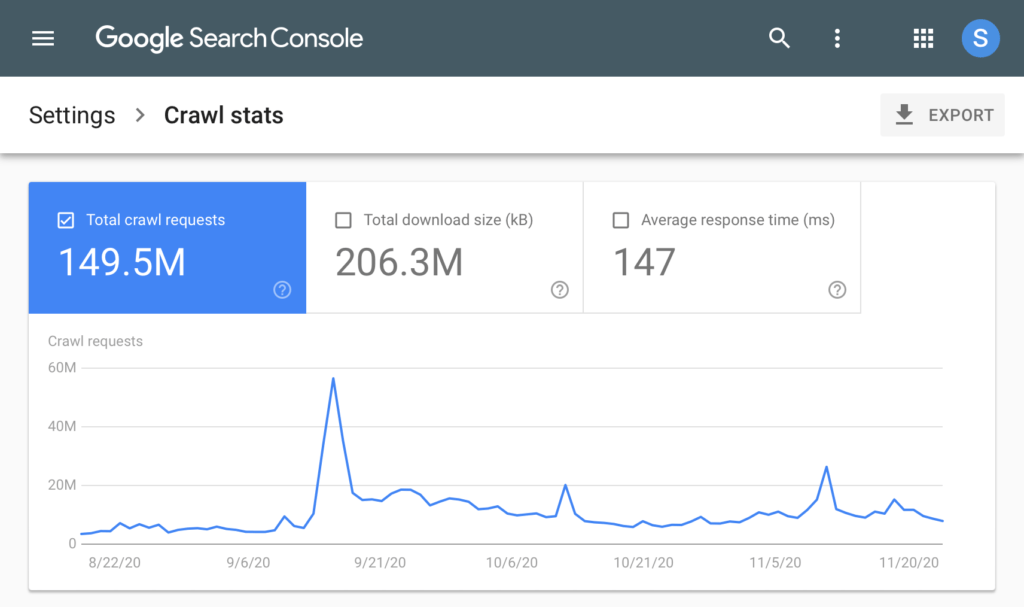
This information can be extremely useful when you've changed site architecture of a site - especially as these changes can impact how Google crawls your site:
This means we can monitor the impact of these changes across different areas of the site.
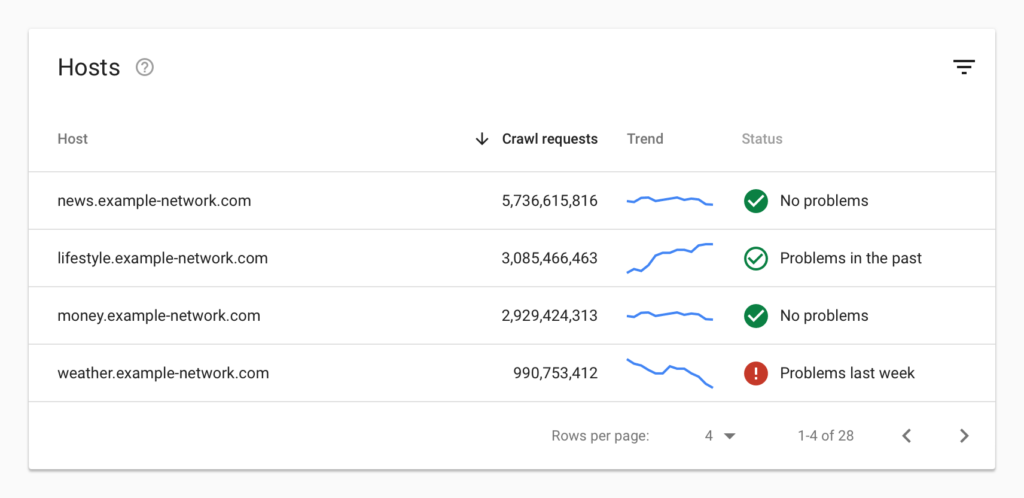
Another interesting change that we are happy to see included is hosts. We have been encouraging our clients to get domain level rather than protocol and subdomain level access to sites, as we often find that odd versions or strange subdomains exist, and being able to see crawl stats from this would be extremely useful.
It's much easier to diagnose an issue when they are grouped - instead of running through thousands of URLs trying to spot the pattern, you get a top level overview of which site sections are running into issues. We typically find that problems are caused at a template level, and having them grouped can make it much quicker and easier to diagnose and spot en-masse, especially when dealing with large and enterprise level websites.
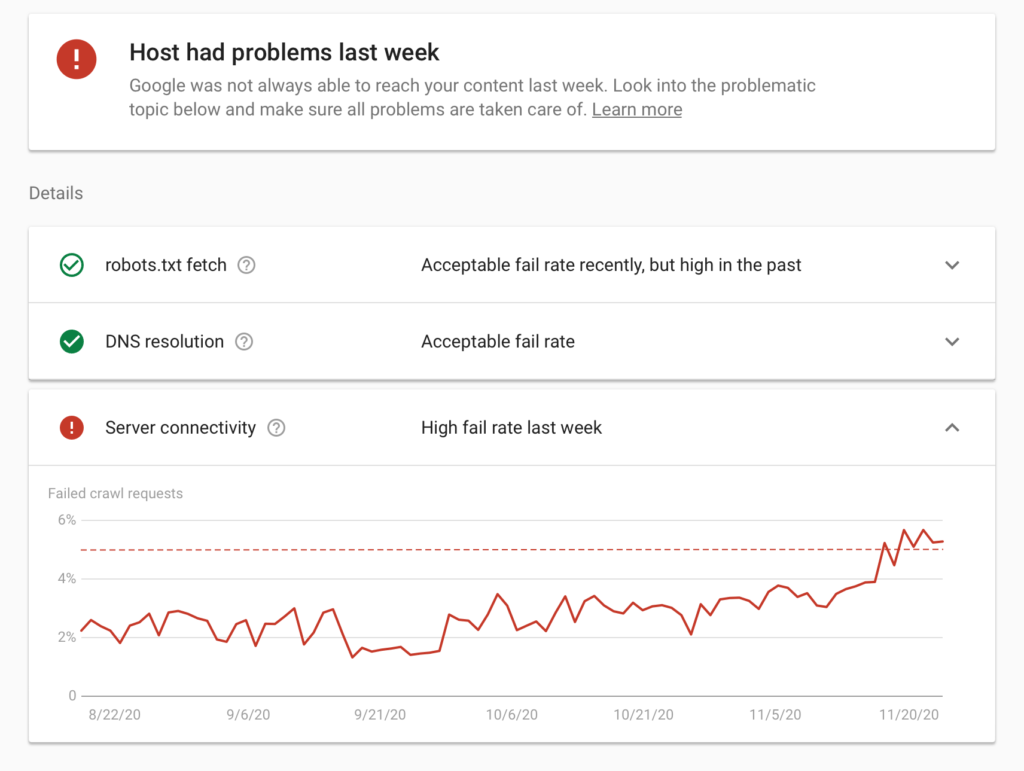
With this new data, we can see a snapshot of the trend over time where we can spot any sudden changes, along with a status to give us a view of whether issues have been resolved or are ongoing. Inside this report, we get a host status details report with a higher level of detail, making it much easier to find the actual culprit of these crawl issues.
If Google is having trouble reaching the robots.txt file of the site, this could be stopping crawls entirely, while DNS issues mean Googlebot is unable to connect to the IP address where the website was located or there were server connectivity issues. You’d need to speak to your web hosting provider or the person who is in charge of managing your website’s server, ascertaining if there have been server connection issues during the period that GSC has highlighted.This information will make it easier to make a business case for potential server upgrades and other technical improvements, which generally are not a very visible area. These issues are typically found out far later down the line, usually after multiple occasions where a site has actually gone down.
This information will be extremely useful to monitor when your site goes through peak seasonality, especially for e-commerce sites when going through big events such as Black Friday, Christmas and January sales, where the amount of traffic heading to the site can be multiple many times over the average.
Crawl Request Breakdown
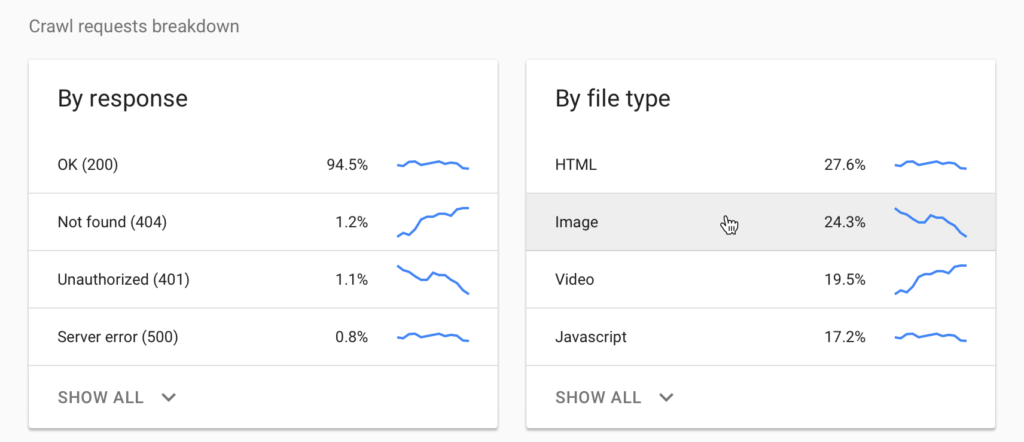
We can now see a breakdown of the crawl request by status code and file type. This information was in GSC previously, but being able to see specifically which errors are happening across the site and how each of these issues are trending, you can potentially pick up on things before they become a bigger problem.
Is there a sharp increase in 404 pages? Sudden jump in 302 redirects? Find which URLs are affected and whether these pages follow a certain pattern, and you can spot issues like a whole product category being accidentally removed or redirected for example. See a large spike in pages with server errors? You can pass these pages on for investigation.
The crawled file types section identifies which files are being crawled, giving greater visibility on what other documents and resources are being crawled and requested. PDFs and images can often be forgotten about, so having these file types grouped together can be really helpful in spotting any issues - perhaps non vital image requests are slowing down the crawl, and these images could be blocked in the robots.txt file? Are there any PDFs being crawled which are no longer required on the site, and could be removed?
You can also see whether internal Javascript and CSS files have any issues - failures here can cause rendering issues, which can affect page load speed or how Googlebot views the content on the page.
Future Improvements
These improvements to Google Search Console are really great - but there are a few items missing that would be very useful to us. What is on our list of things we want to see? We asked the team:
Where to Find in GSC
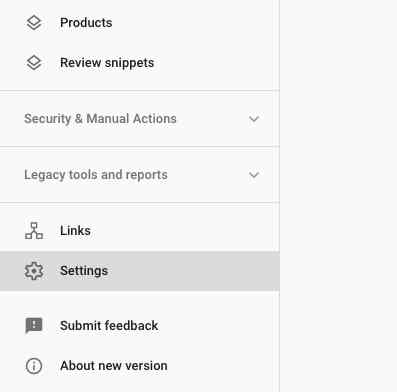
The Crawl Stats section is a bit hidden in GSC, and you will need to go into settings to find it.
If you would like additional information on this new section, check out the Search Console documentation for Crawl Stats.
Have fun, and any questions, drop us a message on Twitter @riseatseven