Searchonomics: The correlation between stock price and search visibility

A company's online presence, in the form of search visibility and its stock price are two commonly used metrics to monitor progress and success, but are the two linked? Does a boost in search visibility lead to an increase in stock price?

In theory, the metrics should be related in the sense that higher search visibility results in more revenue and therefore a better stock price. However, there are multiple factors that have an influence on both metrics, such as government policy, Google updates and industry regulations. Therefore, does visibility have a strong enough connection to stock price in order to impact it? Or are other factors more important.
Looking across 89 brands' search visibility and stock price across 3.5 years, we are able to see the strength of this relationship. The brand with one of the best and strongest relationships was Etsy. The brand’s stock price has risen over 1144% over the time period, whilst it’s visibility also rose 164%.
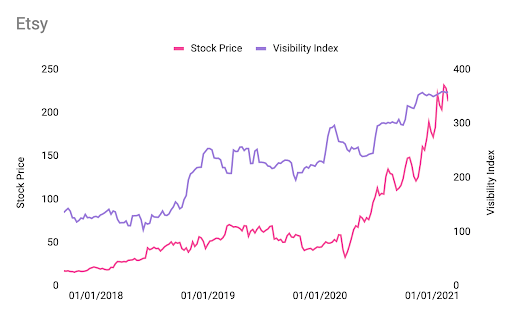
This correlation suggests that as one rises so does the other. But, it could be the case that the company is just doing well in all areas, therefore naturally, increases would be seen across both metrics. To see if both really do relate we need to see that if there is a drop in one metric, there is a drop in the other.

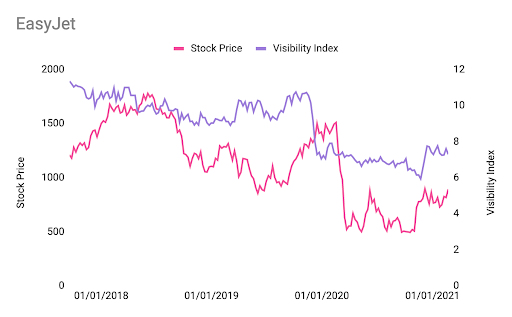
An example of this can be seen with Easyjet, which was the 6th most correlated brand. At the end of 2019 we see that their visibility saw a significant drop followed by their stock price (likely related to COVID), and that in the recovery towards the end of the year the stock price jumped, closely followed by their visibility. Now, this is to be expected as the share price reacts almost instantly to news of travel restrictions, whilst Google and its algorithms aren't as reactive. It does however show that movements in one metric are reciprocated in the other.
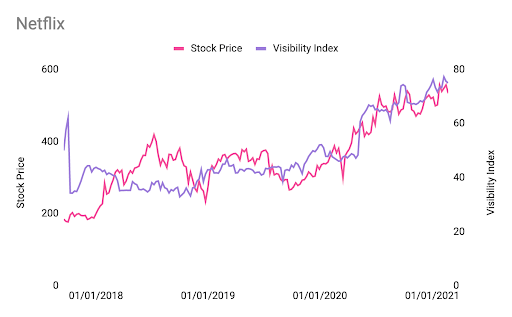
Another example where there has been peaks and troughs is with Netflix, who were the 11th most correlated brand. From the start of 2020 we can see that both stock price and visibility moved in steps, increasing one after another.
Now, there is no clear distinction between which metric impacts the other, especially when looking at the examples. Easyjet shows an initial drop in visibility followed by a decline in stock price, whilst the recovery is initiated by an increase in visibility followed by stock price. All we can conclude at the moment is that when one goes up so does the other and visa versa.
So what does all of this actually mean?
Well, the correlation between the two suggests that visibility is just as important as stock price and that companies/investors should be tracking online growth just as much as any other metric when analysing a business’ progress. It is possible that when there is a significant movement with one metric that a similar reaction is likely to occur with the other.

Methodology
A list of public companies across a range of industries was chosen for the study. I tracked their visibility index (using Sistrix) and stock price over 3.5 years. These figures were normalised (using logs) before calculating their correlation.
The correlation shows if there is a relationship between both variables, it does not show the significance of the relationship. Therefore, a regression analysis was also undertaken to identify if there is a statistical significance between the results.
Correlation figures range from -1.0 to +1.0, companies with a figure of above 0.7 are considered as showing a strong positive correlation. Therefore, indicating that the metrics are related. Second to this, in terms of regression (significance), companies with figures less than 5% show that the data is significantly related, suggesting that the results are statistically related.
Table 1
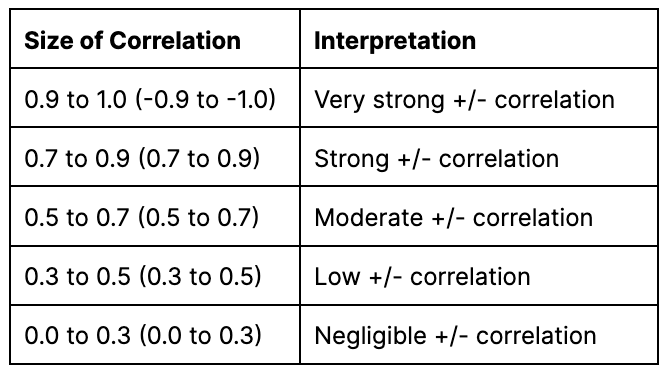
After removing any companies that showed a significance of more than 0.05 (those that were statistically insignificant) 21% of companies showed a strong or very strong correlation, with 67% of these being a positive relationship.
Want to see how we can use data to improve your search performance and even your stock market value? Get in touch at george.sinnott@riseatseven.com or drop me a message on Twitter (@G_sin128)


